Spatially resolved metabolomics is the integration of mass spectrometry imaging and metabolomics technologies to accurately determine the types, contents, and differences in spatial distribution of endogenous/exogenous metabolites in plant tissues and cells. Mass spectrometry imaging technology is widely used in the study of the temporal and spatial distribution of various metabolites, peptides, and proteins in plant tissues due to its advantages of label-free, non-specific, high sensitivity, high chemical coverage, and simultaneous element/molecule detection.
Technical characteristics
Different from traditional metabolomics, spatially resolved metabolomics is another emerging molecular imaging technology. This technology can detect the biosynthesis, transport pathways and accumulation laws of various metabolites in plant tissues. This technology will promote cutting-edge application research such as targeted drug discovery, pathological mechanism analysis, and spatial metabolic network regulation closely related to the growth and development of plants and animals.
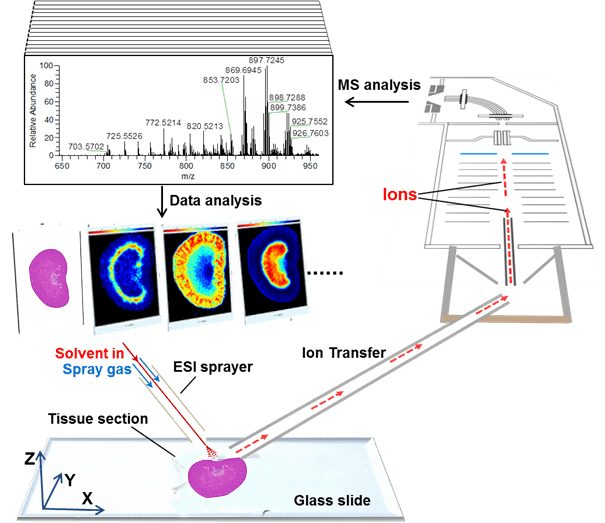 Figure 1. Schematic diagram of spatial metabolomics technology
Service flow
As one of the top companies in the biological field, Lifeasible has been deeply involved in the research of plant spatial-resolved metabolomics for years, and has accumulated rich experience. Our experts can help customers complete a series of one-stop services including sample preparation, spectrogram detection, result analysis and many other related services (Figure 2). We hope that our professional knowledge and efficient service can help our customers promote their project better.
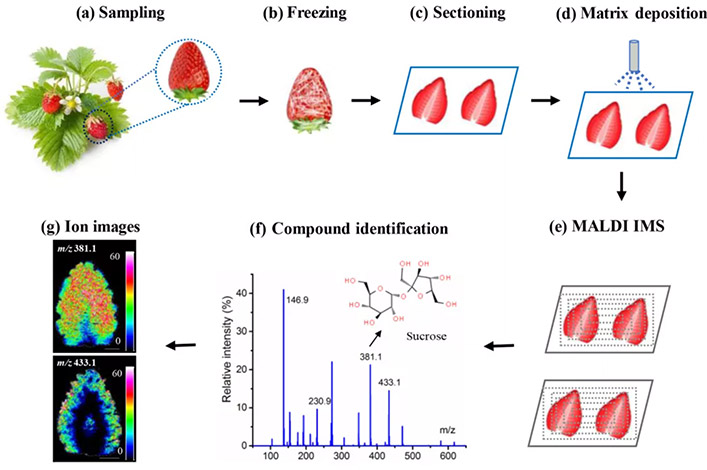 Figure 2. Spatially resolved metabolomics analytical workflow of strawberries, (a) Sample colleting, (b) Freezing of fresh sample, (c) Cryosectioning, (d) DHB matric spray deposition, (e) MALDI IMS data acquisition, (f) Compound identification by MS and MS/MS, (g) IMS data analysis and images export. (Wang J, et al. 2021)
Sample preparation, sectioning and shipping process
Take a tissue sample (no more than 26*76mm of the slide glass), try to ensure the integrity of the tissue, use aluminum foil to make a tin foil boat, and lay the tissue flat in the tin foil boat (note that the plane to be cut faces the bottom of the tin foil boat to keep it flat). Place the tinfoil paper boat with the tissue on the liquid nitrogen solution for 15-30 s, and take out the tinfoil paper boat when the tissue is completely white. Store the samples in a refrigerator at -80°C and transport them on dry ice.
Take tissue samples (not exceeding the size of the glass slide 26*76mm), try to ensure the integrity of the tissue, and prepare the embedding agent. First add 1 mL of embedding agent and spread it in the embedding box, place the tissue in the embedding agent, adjust the position of the tissue, and then add an appropriate amount of embedding agent to cover the tissue. Make sure that the tissue is completely covered, and then freeze the cassette in a dry ice ethanol bath. After the embedding agent is completely white (the freezing process is about 3-5 minutes), the embedding box can be taken out and stored in the refrigerator at -80°C, and transported on dry ice.
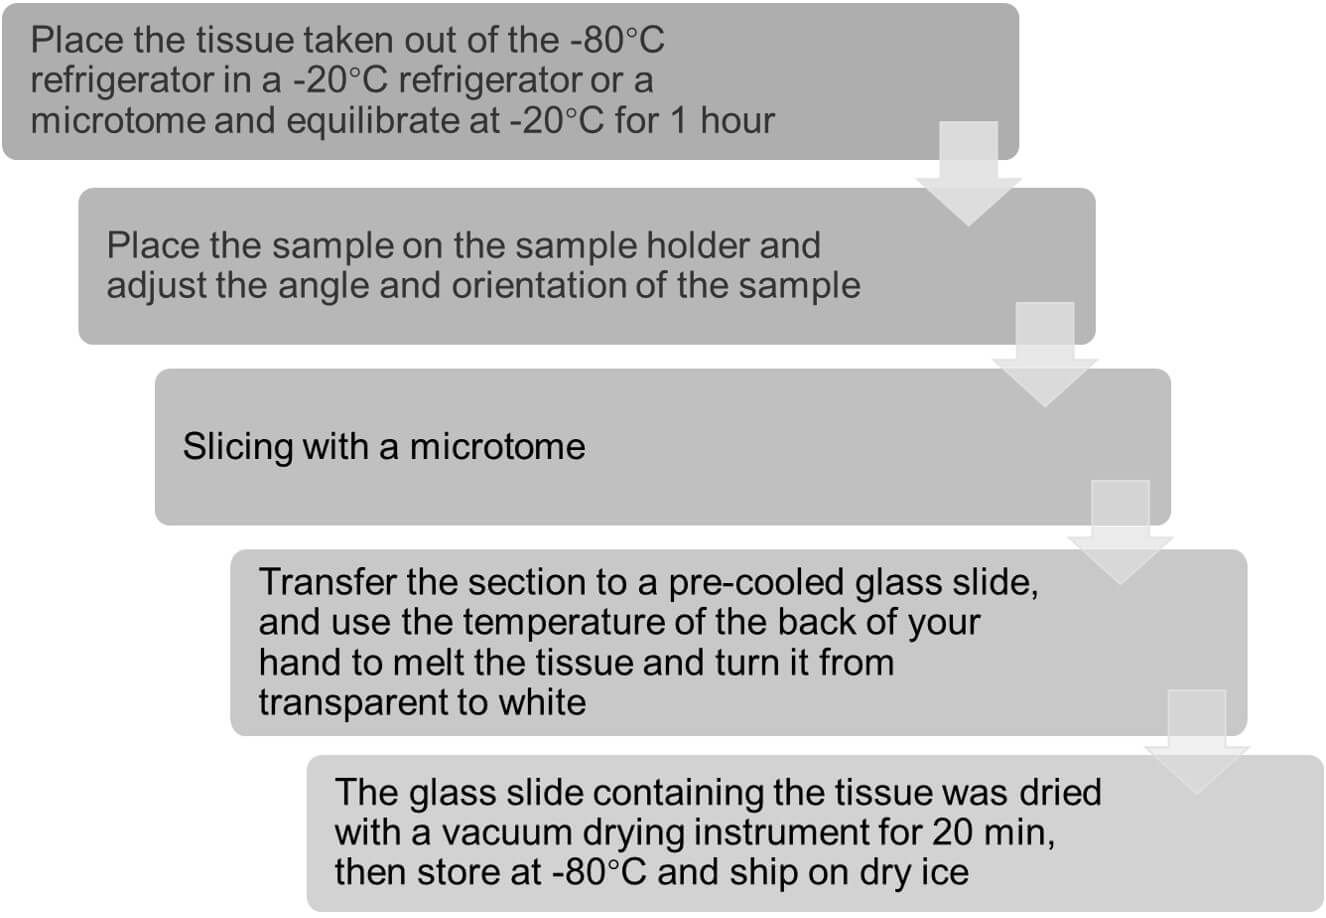
The sample section preparation and delivery process is as follows:
Through spatial metabolomics research on plant samples, taking strawberry as an example, we can identify and map the content and distribution of citric acid, sugar, and anthocyanin in strawberry slices at different ripening stages. The result shows that anthocyanins follow the visual distribution of the red colour seen in the strawberry sections, and most of them are concentrated in the skin and outer cortical sections of strawberries (Figure 3).
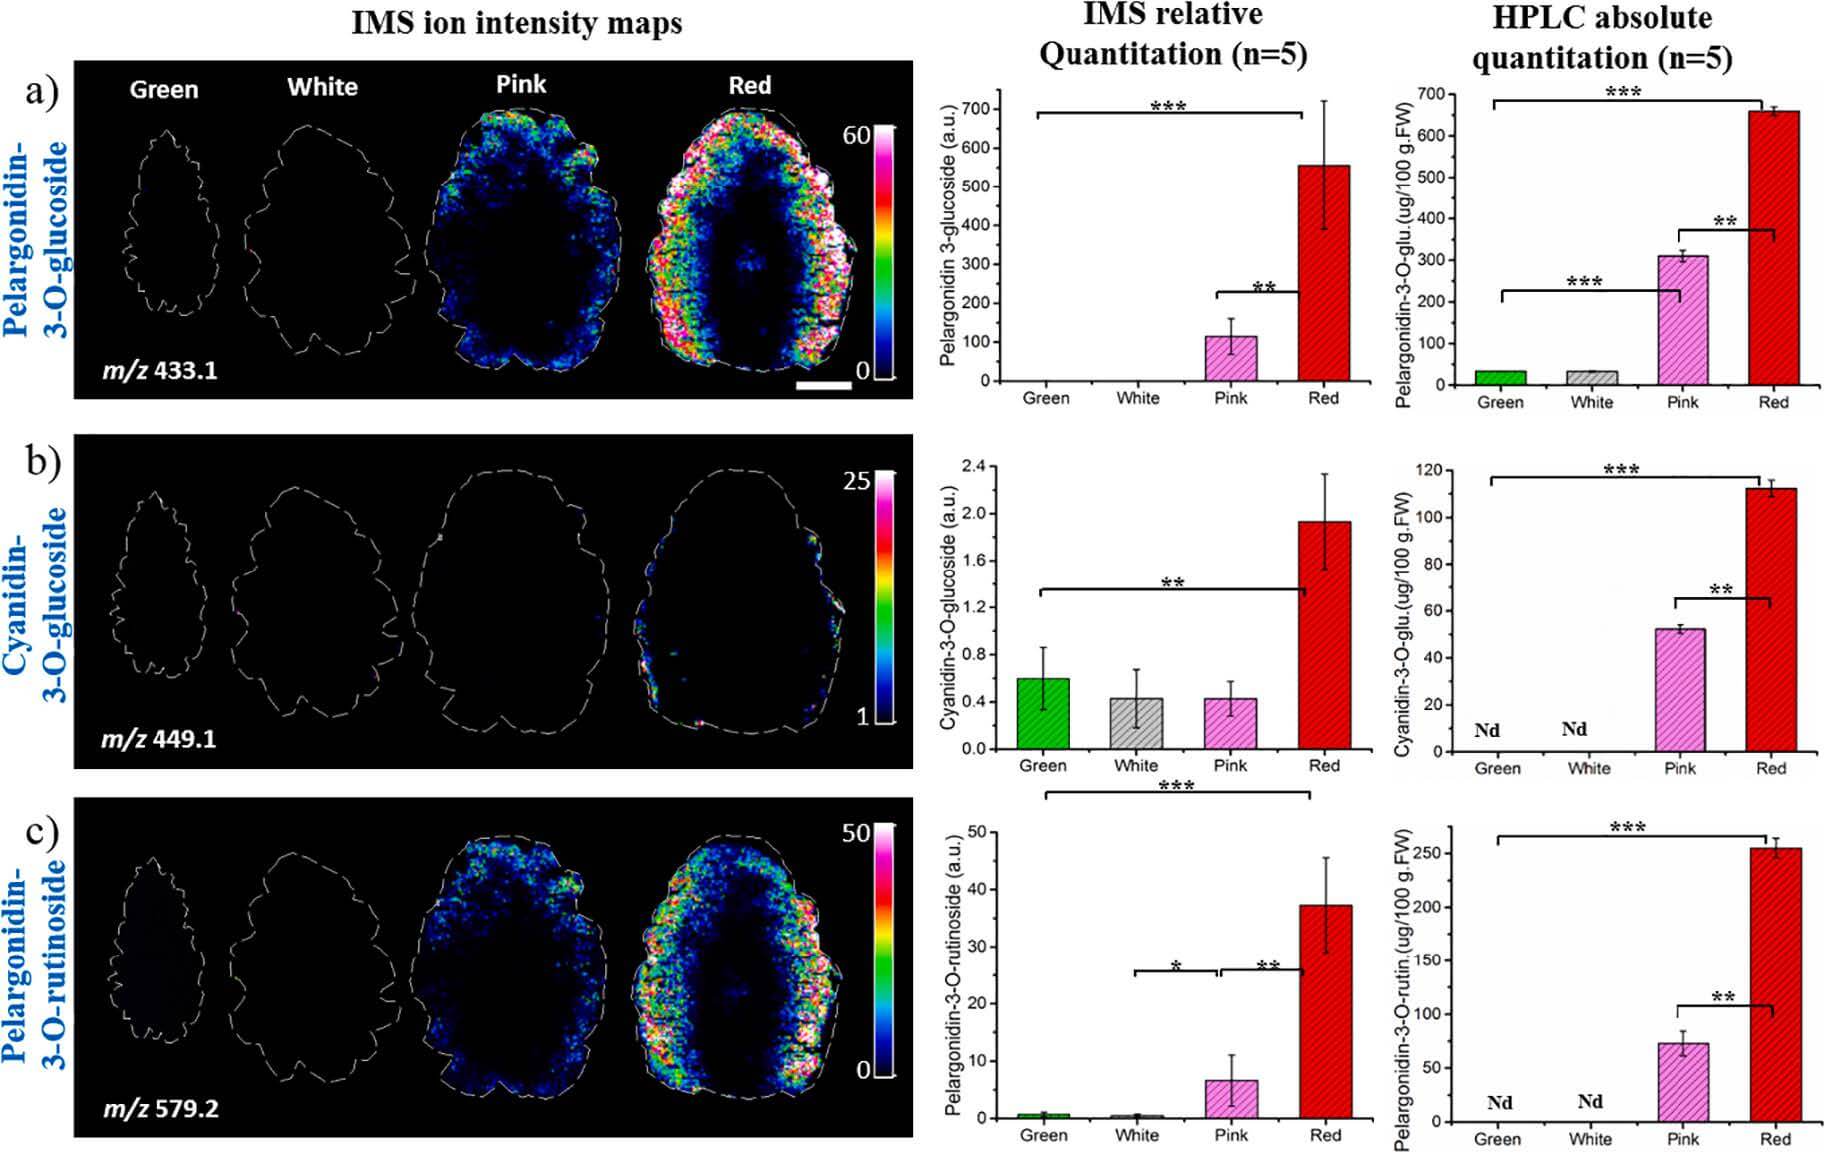 Figure 3. MALDI-TOF IMS and HPLC analyses of anthocyanins in strawberry sections at different maturity stages. (Wang J, et al. 2021)
The plant spatially resolved metabolomics service we provide can help our customers better analyze the nutrient distribution of plants in different forms and development stages. And by combining the color attributes of plants, more in-depth qualitative comparisons can be made, which is conducive to the development of new breeding technologies. For more information or any inquiry requirements, please contact Lifeasible.
References:
Get Latest Lifeasible News and Updates Directly to Your Inbox